REVENUE DRIVEN FOR OUR CLIENTS
$500 million and counting- Home
- Who We Help
- Industries
- SaaS
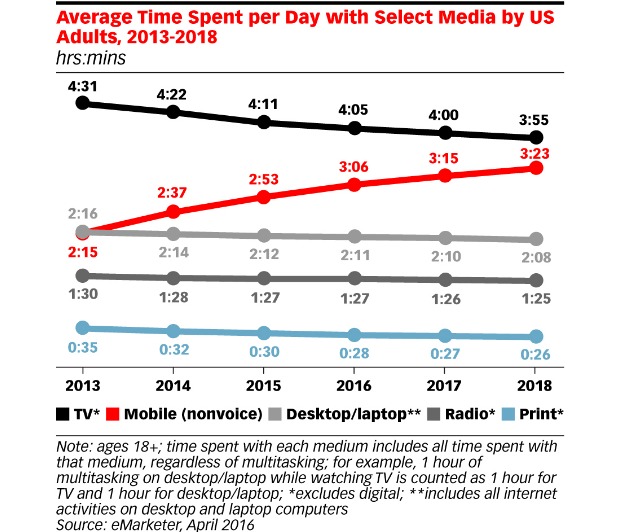
- Time on mobile is mostly app time: People are spending an average of 3:23 per day in apps, and only 50 minutes on the mobile web.
- Nearly 75 percent of US adults will use a smartphone in 2017, as market penetration continues to increase
- Smartphone users spend approximately 10 percent of their time — over 20 minutes per day — on mobile social media.
US Mobile Usage In 2017: Stats You Need To Know
Consumers are spending more and more time on mobile — and less time on everything else, eMarketer reports.

Consumer time spent on mobile is increasing while time spent with all other media is decreasing, according to research from eMarketer — further reflecting the need for marketers to prioritize mobile as the “first screen” that it has truly become.
From 2016 to 2017, time spent per day on mobile has reportedly increased by seven minutes, reaching a total 3 hours and 15 minutes per day. In the same time period, time spent on desktop decreased by one minute and TV viewing decreased by five minutes.
A matter of minutes may not seem drastic, but it matters more and more each year. Additionally, while time spent on mobile devices eclipsed desktop all the way back in 2014, it took marketers far longer to realign their ad spend; paying attention to shifts in mobile usage now means that they can avoid being caught in the same position in the future, such as when mobile finally eclipses TV.

Other key statistics about mobile usage in 2017:
© 2025 WYTLABS (A Brand of Digimagnet INC.) All Right Reserved.
Schedule My 30 Minutes Consultation Call
We use cookies on our site to provide you with the best user experience. We will assume that you are agreeing to our Privacy Policy, if you continue accessing this website.OK, I AgreePrivacy policyGet a Proposal
- Industries
 CLIENT LOGIN


 99 South Almaden Boulevard, San Jose, California, 95113